Working on Timing Guarantees for AI in Healthcare
Research on making AI-assisted surgery predictable and safe, and what I learnt from academia
Context

Imagine a surgeon performing a delicate operation wearing AR glasses that overlay AI predicted organ positions onto the live surgical feed. Systems like these could go from assistance to performing minor surgeries in a lot of situations. We could deploy such robots in underdeveloped regions with shortage on trained doctors and help a lot of people. These tools run locally without needing internet. Industrialization of full surgical robots is way out in the future though. Right now assistance tools help in education, preserve context during surgeries, and help doctors make better decisions, for example which maneuvers to perform when.
These systems need to be reliable. A lag of even a few milliseconds during surgery could be catastrophic. My work with Dr. Arpan Gujarati, Philip Schowitz, and others focused on exactly this problem. Applications like ORSI Multi AI AR run on NVIDIA's Holoscan SDK.
Fair warning: the following sections get a bit technical.
How Holoscan Applications Work
Before diving into our work, let me explain how these applications actually work under the hood.
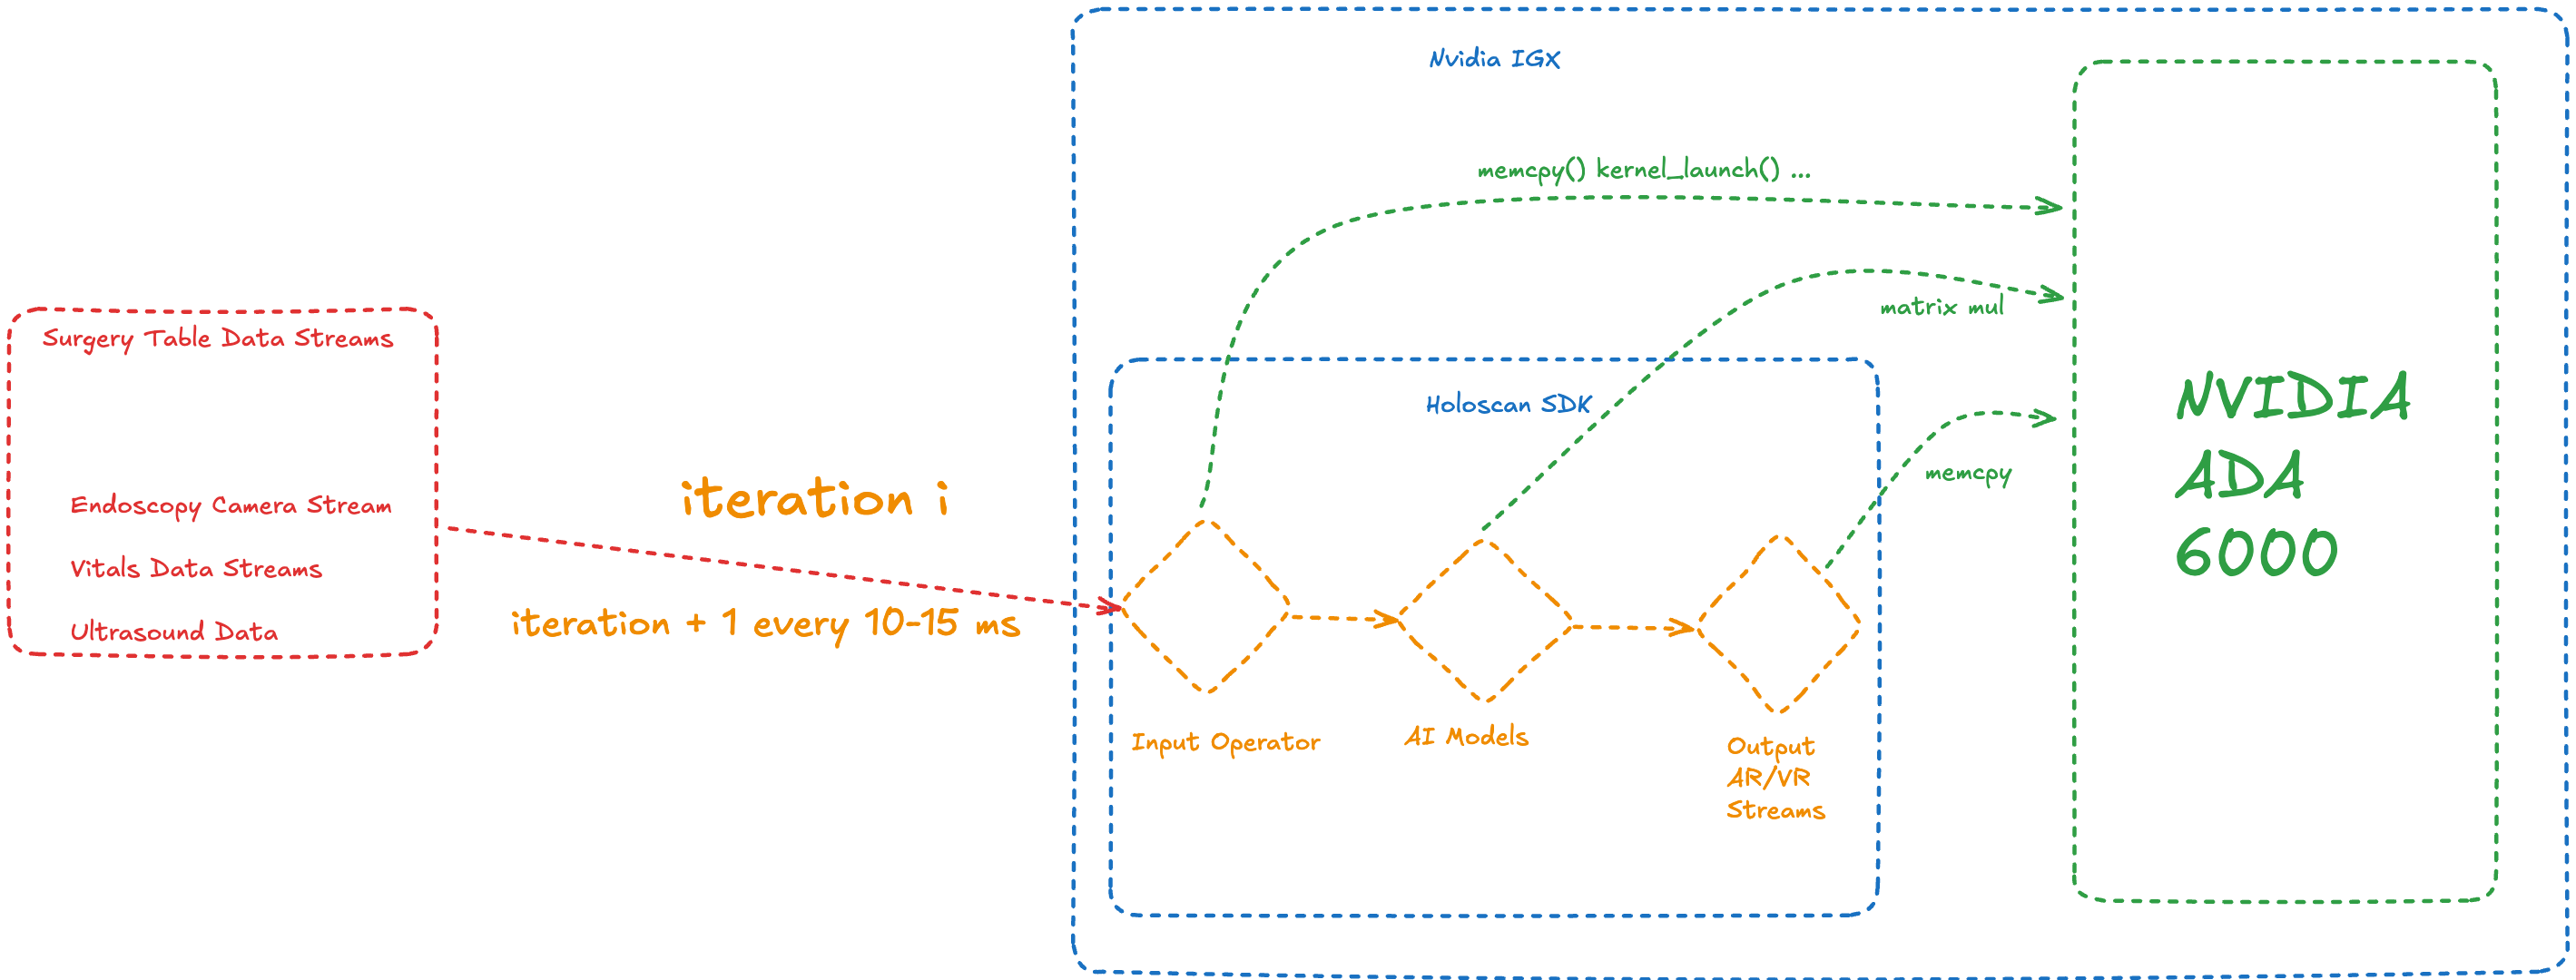
In the diagram above, you can see the pink boxes representing "Surgery Table Data Streams." These are streams of real-world data flowing into the Holoscan application: endoscopy camera frames, ultrasound video data, and information like vitals. These get ingested "per frame," which means each Holoscan iteration processes one video frame or a piece of information sent every few milliseconds.
Each application is basically a graph structure. You can have complicated DAG structures, but for this illustration, I kept it simple. There's usually an input operator that takes these streams, converts them into data the AI models can use, and loads them onto the GPU.
Here's where it gets interesting: each operator in the graph is connected via queues. Input operators typically have a queue with buffer size 1, so if it's processing the ith frame, it keeps the i+1 frame in the queue buffer. Frames after that might get dropped if not processed on time (depending on buffer size and queue policies).
Once done, the second operator (AI models in our illustration) receives information or signals about the iteration, could be information about where data is stored, or just CUDA context. They launch kernels based on this information and send results forward to operators that convert their output into human-readable formats like VR/AR streams.
The CPU part of these operators can be async from the GPU part. The input operator could launch kernels on the GPU and forget about them, then just tell the next operator about those kernels so it can depend on them. It can launch kernels that depend on the previous ones, and so on. So CPU iterations can normally move ahead by i+3 compared to GPU iterations with a queue size of 1. (It's intuitive how to figure this out, but for simplicity, just assume this is the case.)
The Work
My work spanned two interconnected research directions. This contributed to a paper accepted at RTSS 2025: "Faster, Exact, More General Response-time Analysis for NVIDIA Holoscan Applications" (Philip Schowitz, Shubhaankar Sharma, Soham Sinha, Bruce Shepherd, Arpan Gujarati).
Timing Analysis
I needed to validate the theory with real-world data. This meant benchmarking Holoscan applications on NVIDIA IGX Orin hardware to determine WCRT values (worst-case response time). These benchmarks ran for days.
I developed an artifact that automated WCRT measurements using UPPAAL (a formal verification tool). This got accepted at RTSS 2025. (GitHub Repository: rt-holoscan-artifacts)
I've later realized that artifacts are a very integral part of real-time systems and some other CS fields. They give reviewers a solid way to verify our theory is correct, our benchmarking methodology is sound, and our results are reproducible.
GPU Scheduling
The second half of my internship and ongoing work focuses on a different question: could we reduce latency and jitter by changing how the GPU allocates resources? CPUs have 8-16 cores. GPUs have hundreds of parallel streaming multiprocessors (SMs). Holoscan has unique queueing behavior we could exploit. We wanted to guarantee the system won't take longer than X milliseconds with minimal variance in output timing.
Tracing operations in a GPU-accelerated pipeline is complex. As I explained earlier, the CPU and GPU operate on different clocks. The pipeline can move ahead on the CPU while earlier tasks execute on the GPU, sometimes the CPU is three iterations ahead. I created a Python script to recreate CPU iterations and their related GPU kernel executions, and understand GPU kernel scheduling time.
After developing a metrics analysis framework, I could quickly analyze proposed policies. However, the first experiment design proved infeasible (exponential runtime scaling). After two months of work, this was disappointing. I had fallen victim to confirmation bias. When I got results that matched my expectations, I didn't dig deeper to verify them.
We redesigned the experiment with linear runtime scaling. After several iterations, our policy reduced application jitter, providing more consistent outputs and better P99 latency.
Understanding GPU Resource Allocation
To understand why our policy works, we need to talk about how kernels get scheduled on the GPU and how streaming multiprocessors (SMs) are allocated.
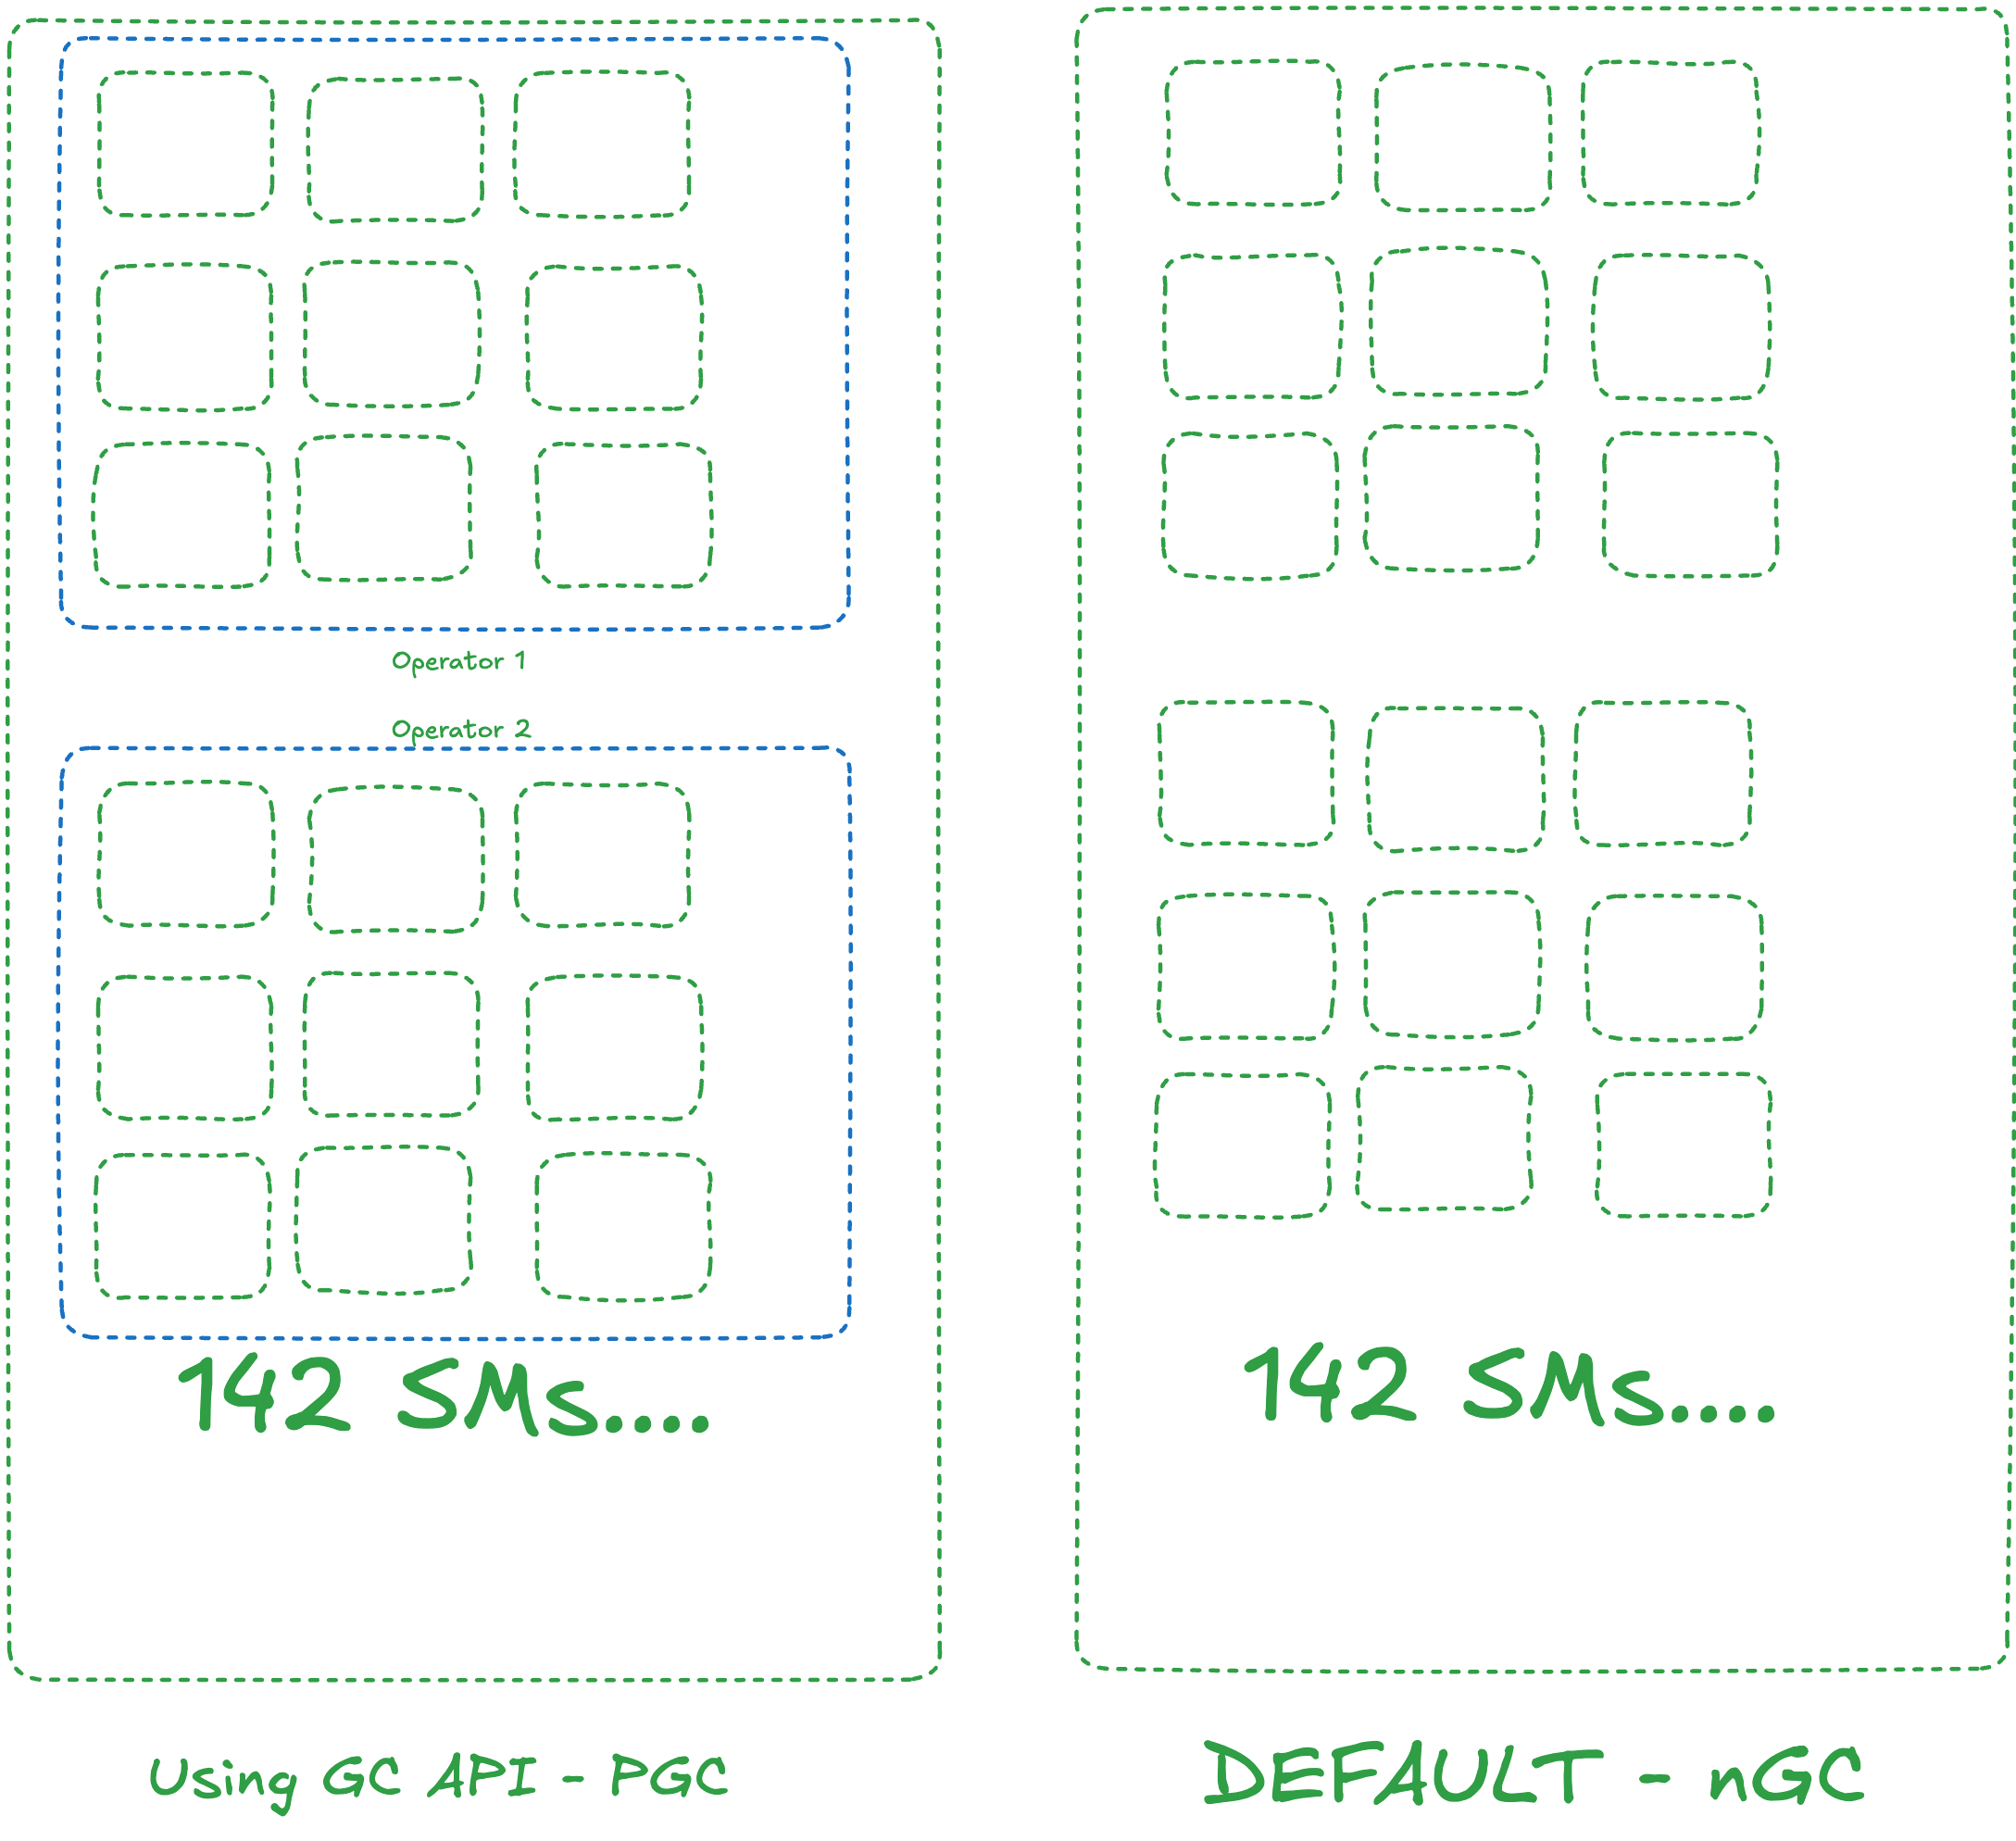
An NVIDIA Ada 6000 has 142 SMs. Since kernel code expects parallelism, the more SMs you give to a single kernel, the faster it runs.
Here's the problem: NVIDIA didn't tell us how the internal queue system of the default resource allocation policy (nGC) works. We had to figure it out through microbenchmarking. From what we could determine, it's very first-come-first-serve. As you queue kernels, they get SMs from the GPU allocator accordingly. Some kernels that came first got more SMs, and kernels that came later got less. The GPU isn't smart enough to know which workload is more important.
With the Green Context (GC) API, we can create resource allocators that are smart enough to allocate SMs in a way that makes sense because we know more about the workload. We tried a lot of static partitioning approaches and achieved good results, but we're now trying to figure out if there's a possibility for dynamic allocation with custom allocators.
When you divide SMs into Green Context groups for your operators inside the application, this is my intuition: I think the queues also split up, which is why kernels launch way faster. In my microbenchmarks, GC always benefitted from instant kernel launches, whereas with the default policy, it can take a while. Plus, with GC, we had way less jitter and way more consistent performance.
Interactive Demo
Below is an interactive simulation showing how our Green Context (pGC) policy improves frame delivery consistency compared to the default nGC policy. This is novel work still in progress. The simulation shows two pipeline policies processing events through a 5-stage pipeline.
Default Policy
Dropped Events
Green Context Policy
Dropped Events
The default nGC policy creates unbalanced compute allocation. Fast stages process frames quickly while the bottleneck stage creates backpressure. When busy with a queued frame, new frames drop. Result: inconsistent output, dropped frames.
Our pGC policy achieves balanced allocation with consistent processing (~22ms across all stages). No bottlenecks, the queue never overflows. Result: zero frame drops, consistent output.
The critical insight: by managing GPU streaming multiprocessor allocation, we can make event processing consistent along the pipeline. The default policy drops frames because unbalanced stages process at mismatched rates, causing queue overflow.
Reflections
This internship opened doors to a whole new world of thinking for me. I learnt that research requires strong theoretical foundations, theory should predict what you expect to see. When reality deviates from your theory, that's when you start to dig and find out about new things. Before this, I thought I understood the scientific method, but I really didn't. Confirmation bias is incredibly powerful, even when you know about it, you can still fall victim to it. You see the patterns you want to see, and peer review, reproducibility, and publishing artifacts help mitigate this.
Through this research, I started diving deep into epistemology, exploring how we know what we know and how our perception can deceive us. I discovered Bell Labs and learned about the invisible engineers whose work shapes our entire modern world: the transistor, Unix, C, information theory, all from one lab. It showed me that you can have a profound impact by diving deep into specialized research.
What struck me was how deep every field goes. I'm experiencing this at PlanetScale, where I'm working on neki (a sharded Postgres system). I'm diving into SQL databases: query planning, storage orchestration, it's endless.
I'm also working on research around probabilistic concurrency testing. We're still working on deeper investigations into GPU scheduling policies at Systopia. We have one paper published at RTSS 2025.
After seeing the mind blowing work people do, I'm grateful for the people and organizations that have supported me on this journey. Sequence, Systopia, and PlanetScale have given me opportunities to work on things that truly intrigue me and can lead to small contributions to science. I hope I can do that throughout my life.